

2025 identity theft statistics: Record losses, emerging scam tactics & who’s most at risk

This analysis combines FTC Consumer Sentinel Network data, OmniWatch survey insights, and state-level breakdowns to assess the scope of identity theft and fraud across the United States.
Key highlights
- Identity theft reports filed between January and September 2025 already exceed the total number filed in all of 2024.
- Losses have grown at an average rate of ~27% per year, signaling a sustained, structural escalation rather than a temporary spike.
- Credit card fraud, loan or lease fraud, and rapidly expanding “Other” identity theft categories are driving record report volumes.
- Social media is now the primary fraud contact method for identity theft in most age groups.
- Job scams continue to soar amid economic uncertainty, and imposter scams surpass $1 billion in losses in a single quarter alone (Q3 2025).
- 80% of investment scams result in financial loss, with a median value of $10,000 per victim.
Identity theft hits record levels in 2025
2025 is on track to be the worst year on record
- 2025 Q1–Q3 reports: 1,158,000
- 2024 full-year reports: 1,135,265
- Increase: 2.0% — marking the first time three quarters have exceeded a prior full year
- Projected 2025 full year: 1.54 million reports (+36% vs. 2024) using a conservative Q1–Q3 average
Full-year data projections based on the average quarterly growth rate in 2025 (4.95%) suggest this year could be on track to reach to 1.86 million identity theft reports by the end of Q4, depending on seasonality effects.
Financial losses have doubled since 2021
Financial losses tied to fraud and identity-related crimes are rising at a compounding pace, more than doubling over the past four years. Total losses increased from approximately $5.4 billion in 2021 to over $11 billion by 2024.
- 2021: $5.38B
- 2022: $7.92B (+47% YoY)
- 2023: $9.14B (+15% YoY)
- 2024: $11.03B (+21% YoY)
- 2025 (Q1–Q3): $10.91B (already within ~1% of 2024)
Three identity theft categories driving the 2025 surge
The following categories account for 1,061,640 fraud reports in Q1–Q3 2025, already exceeding 2024’s full-year total (984,530) by 7.8%.
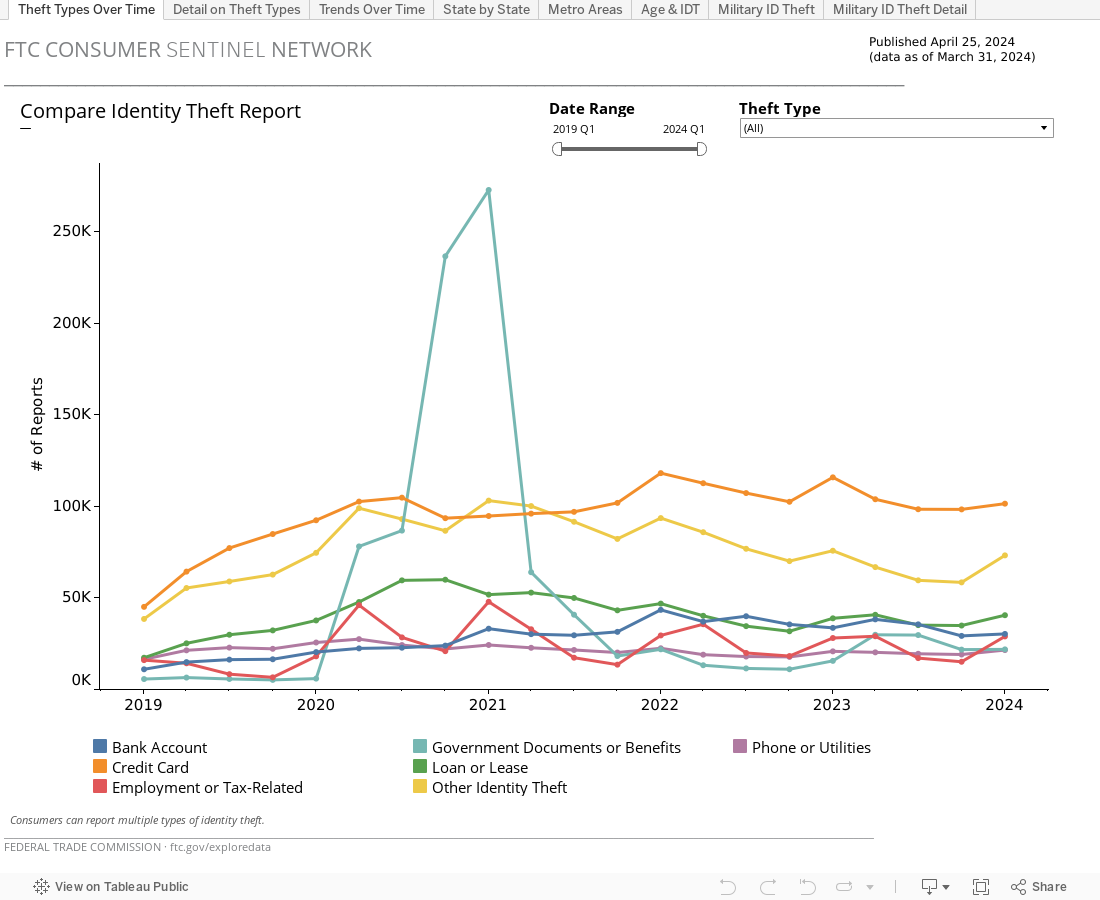
- Credit card fraud: Largest category, fastest growth
Credit card fraud remains the most common and fastest-growing form of identity theft.
- 2024 (full year): 449,090 reports (quarterly average: 112,272)
- 2025 (Q1–Q3): 503,450 reports (quarterly average: 167,817)
- Growth: +49.5% quarterly average increase
- Q1–Q3 2025 exceeds 2024 full year by: 12.1%
- Quarterly acceleration:
- Q1: 151,644
- Q2: 166,244 (+9.6%)
- Q3: 185,562 (+11.6%)
- Loan & lease fraud: Steady growth, long-term damage
This category includes fraud involving auto loans, personal and business loans, student loans, real estate, and rental housing.
- 2024 (full year): 176,417 reports (quarterly average: 44,104)
- 2025 (Q1–Q3): 178,210 reports (quarterly average: 59,403)
- Growth: +34.7% quarterly average increase
- 2025 already equals 101% of 2024’s total
- Quarterly trend:
- Q1: 56,763
- Q2: 58,007 (+2.2%)
- Q3: 63,440 (+9.4%)
- “Other” identity theft: Early warning of emerging tactics
The “Other” category shows one of the most sustained growth patterns in FTC data with no meaningful pull-backs, indicating a durable—not seasonal—trend.
- Q1 2025 vs. Q1 2024: +79% year-over-year
- 2024 (full year): 359,023 reports (quarterly average: 89,756)
- 2025 (Q1–Q3): 379,980 reports (quarterly average: 126,660)
- Growth: +41.1% quarterly average increase
- 2025 exceeds 2024 by: 5.8%
Common subtypes include:
- Email or social media account misuse
- Online shopping and payment platforms
- Insurance and medical identity theft
- Securities and hybrid account abuse
Social media becomes the primary contact channel for identity theft
Digital contact methods dominate 6 of 8 age groups overall:
- Websites and apps dominate for ages 30–49
- Social media is the #1 contact method for ages 20–29, 50–59, 60–69, and 70–79
- Phone calls remain primary only for adults 80+
Imposter scams surpass $1 billion in a single quarter
Imposter scams represent one of the most devastating fraud categories. Although the victimization rate is lower compared to other fraud categories (with 21% of reports resulting in financial loss), there is a high financial impact when victims do lose money.
Fraud statistics in Q3 alone demonstrate the scale of impact:
- Total losses: $1.02 billion
- Total reports: 279,487 (840,409 imposter scam reports in 2025 Y2D), indicating widespread targeting
- Victims who lost money: 58,692
- Median loss per victim: $700
- Average loss per victim: $17,324

Subcategory breakdown (Q3 2025):
- Government imposters: 114,062 reports, $280M losses (27.5% of total) - Fastest growth
- Business imposters: 128,996 reports, $306M losses (30.0% of total) - Highest volume
- Romance scams: 18,888 reports, $398M losses (39.0% of total) - Highest median loss ($2,050)
- Tech support: 16,121 reports, $65M losses (6.4% of total)
- Family & friends: 10,549 reports, $27M losses (2.6% of total)
Government imposter scams: Explosive growth in 2025
2025 year-to-date reports already exceed the 2024 full year by 25.5% — the largest surge of any imposter scam type.
- 2024 (full year): 265,272 reports
- 2025 YTD (Q1-Q3): 332,796 reports
- Growth: 25.5% above 2024 in just three quarters
- Q3 2025: 114,062 reports, $280M in losses
- Q2 2025 peak: 134,689 reports (highest single quarter)
- Victims who lost money: 13,500 in Q3 2025
- Median loss: $800 per victim in Q3 2025
Business imposter scams: Highest volume, largest total losses
Business imposters remain the most prevalent imposter scam type by volume.
- Q3 2025 reports: 128,996 (largest of all imposter scam subcategories)
- Victims who lost money (Q3): 30,362
- Total losses (Q3): $306M (highest of all subcategories)
- Median loss: $500 per victim
- 2025 YTD: 396,227 reports (88% of 2024 full year in just three quarters)
Romance scams: Highest median loss and victimization rate
Romance scams statistics show the highest median loss ($2,050) and the highest victimization rate (59.5%) of all imposter scams. Although report volume is lower, the financial impact per victim is severe.
- Q3 2025 reports: 18,888
- Victims who lost money (Q3): 11,242 (59.5% victimization rate - highest)
- Total losses (Q3): $398M
- Median loss: $2,050 per victim (highest of all imposter scams)
- 2025 YTD: 55,604 reports (91% of 2024 full-year total)
Romance scam financial impact by age
- Senior median losses: $5,000-$12,000 per incident
- Ages 60-69: $143.9M lost in Q1-Q3 2025 (highest of any age group)
- Ages 50-59: $86.2M lost
- Ages 40-49: $62.0M lost
Victimization by marital status (OmniWatch/YouGov data):
- Divorced: 33.1% victimization rate (highest—41% higher than married)
- Single: 26.3%
- Widowed: 26.4%
- Married: 23.4% (lowest)
Tech support imposter scams: Declining volume, persistent financial harm
- Q3 2025 reports: 16,121
- Victims who lost money: 3,264 in Q3 2025
- Total losses (Q3): $65M
- Median loss: $1,362 per victim
- 2025 YTD: 51,530 reports (74% of 2024 full-year total)
Family & friend imposter scams: Lower volume, trust-driven losses
- Q3 2025 reports: 10,549
- Victims who lost money: 3,159 in Q3 2025
- Total losses: $27M in Q3 2025
- Median loss: $750 per victim
- 2025 YTD: 29,429 reports (85% of 2024 full year)
Investment scams: Most financially devastating fraud category
Eighty percent of investment scam reports result in financial loss—the highest victimization rate of any fraud type.
- Q3 2025 reports: 39,870
- Victims who lost money: 31,896 (80% of reports)
- Total losses (Q3): $2.15B
- 2025 YTD losses: $6.11B
- Median loss: $10,000 (highest of any category)
- Average loss: $67,316 (skewed upward by high-dollar outliers)
- Age 60-69 age group: $501.8M lost in Q1-Q3 2025 (highest of any age group, any category)
Job scams continue to soar amid economic uncertainty
Business and job opportunity scams remain a major and growing threat.
- Q3 2025 reports: 51,300
- Victims who lost money: 14,876 (29% of reports)
- Total losses (Q3): $260.1M
- Median loss: $2,000 (average loss of $17,485)
Age-based fraud risk: Who is targeted most—and who loses the most
Adults ages 40–49 face the highest combined risk
- Reports per 100K: 168.14 (highest of all age groups)
- Median loss: $432
- Risk profile: Peak earning years with high credit activity and multiple financial accounts
Seniors face the highest loss severity
- Median loss (80+): $1,964—more than 13x higher than victims under 19
- Median loss (70-79): $1,000
- Median loss (60-69): $880
- Investment scam losses (ages 60-69): $501.8M in Q1-Q3 2025
According to OmniWatch survey data, more than one in four people (27.7%) ages 55 and up receive 11 or more suspicious communications per week.
Age group risk summary
| Age Group | Reports/100K | Median Loss | Risk Level | Key Vulnerability |
|---|---|---|---|---|
| 40-49 | 168.14 | $432 | Highest Combined | Peak earning years, high targeting |
| 30-39 | 166.60 | $375 | High | High volume, moderate losses |
| 20-29 | 150.84 | $322 | High | Payment app fraud, job scams |
| 70-79 | 149.51 | $1,000 | Moderate | Investment scams |
| 60-69 | 138.07 | $638 | Moderate | Investment scams ($501.8M lost) |
| 50-59 | 132.76 | $500 | Moderate | Romance scams & investment scams |
| 80+ | 77.30 | $1,964 | High (Loss Severity) | Highest median loss, government imposters |
| 19 & Under | 21.83 | $150 | Low | Lowest risk, but still vulnerable |
Regional hotspots: Where identity theft Is most concentrated
Identity theft per capita: Top 15 states
The following states reported the most cases of identity theft per 100,000 residents.
| Rank | State | Reports per 100K: Y2D 2025 (vs 2024) |
# of Reports (2024) | Regional Pattern |
|---|---|---|---|---|
| 1 | Florida | 617 (vs 528) | 115,840 | South |
| 2 | Georgia | 585 (vs 517) | 55,955 | South |
| 3 | Nevada | 461 (vs 466) | 14,631 | West |
| 4 | Texas | 434 (vs 393) | 116,484 | South |
| 5 (⇡3) | Louisiana | 405 (vs 346) | 15,991 | South |
| 6 (⇡3) | Illinois | 401 (vs 339) | 43,028 | Midwest |
| 7 (⇣2) | Delaware | 390 (vs 392) | 3,942 | Northeast |
| 8 (⇣1) | California | 345 (vs 356) | 139,665 | West |
| 9 (⇡1) | Maryland | 345 (vs 324) | 19,990 | Northeast |
| 10 (⇡7) | Mississippi | 344 (vs 268) | 7,903 | South |
| 11 (⇡2) | South Carolina | 334 (vs 291) | 15,146 | South |
| 12 (⇣1) | New Jersey | 318 (vs 313) | 29,037 | Northeast |
| 13 (⇡3) | Alabama | 314 (vs 269) | 13,596 | South |
| 14 (⇡5) | North Carolina | 297 (vs 260) | 27,468 | South |
| 15 (⇣1) | New York | 297 (vs 295) | 58,692 | Northeast |
States by total report volume
- The top three states by absolute number (Florida, Texas, and California) account for more than half (54.91%) of all U.S. identity theft reports in 2024.
- Three states (Florida, Georgia, and Nevada) maintained their 2024 rank in 2025, holding down positions #1-3. However, the sharp increase in victims in states such as North Carolina and Mississippi suggest the problem is quickly spreading—especially in Southern regions.
- 13 out of 15 states with the highest identity theft per capita have already surpassed their total volume of reports filed in 2024 within just the first nine months of 2025.
Key recommendations
1. Ages 40-49: Highest combined risk—comprehensive identity protection needed for consumers during their peak earning years, who often have families to provide for and
2. Seniors (55+): Receive the highest volume of suspicious communications (27.7% get 11+ per week) and report the highest losses—proactive education and fraud prevention tools are essential components of senior identity protection.
3. Divorced, single, or widowed individuals: Face higher risk of victimization from romance scams (33.1% for divorced2)—scam protection insurance can provide peace of mind against potential financial losses.
4. All consumers: Only 21.2% use identity protection services2—indicates a major protection gap despite high awareness among consumers.
Data sources
- FTC Consumer Sentinel Network: Identity Theft by Type (2024-2025), State Rankings (2024), Quarterly Fraud Data (2025 Q1-Q3)
- OmniWatch Identity Theft Survey Data: 2024 Consumer Fraud Awareness Survey conducted with YouGov in September, 2025 (N. 1,112)
- U.S. Census Bureau: 2023 Metropolitan Statistical Area Population Estimates (for per-capita calculations)
